Visualisation

A picture is worth a thousand words. At ITP we work hard to ensure our reporting remains succinct, allowing visual evidence to take centre stage.  

Since forming in 1998 we have been at the cutting edge of data visualisation - whether it's using GIS to present transport data and how it relates to specific places, or developing 3D fly-through models to bring BRT system designs to life.

Website Image Thematic Map V3

Innovative data visualisation involves using graphic design and web-based mapping to create outputs that people can readily understand.

This is particularly important when seeking to share the findings of our work with communities whose first language is not English.

Capabilities

  • Geo and web-based data presentation
  • 3D fly-through models and videos
  • Infographics and high quality maps
  • Artist's impressions and schematics

Transport Analyst

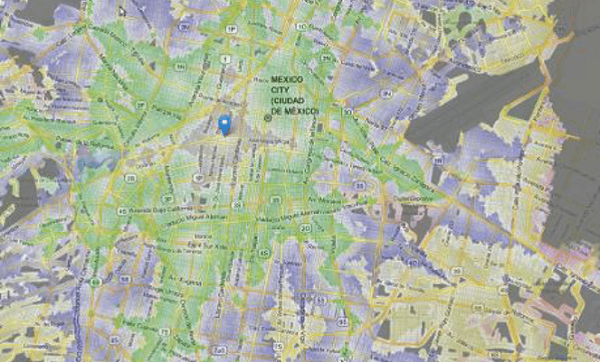
Mexico City Government sought to reform franchising and service planning for Microbuses, to better integrate them with the city’s scheduled and fixed-line public transport services.  Working with World Bank and Conveyal colleagues, ITP helped develop an Open Source accessibility modelling tool called Transport Analyst.  It consumes General Transit Feed Specification (GTFS) and Open Street Map data to provide on-demand accessibility maps and calculations.

We worked with a community of potential software developers to agree key accessibility indicators and supported SETRAVI, the city transport authority, to raise awareness of the tool and build local capacity so it can continue to inform future city zoning and development.  Transport Analyst was subsequently re-used through World Bank initiatives in Buenos Aires, and Dhaka to build local knowledge and skills on these topics.

Data Visualisation 2
Data Diagram Uber

Transport Data Revolution

The Transport Systems Catapault wanted to understand the ‘state of play’ for intelligent mobility in respect of transport data sources, aggregation and manipulation techniques, and current / future data applications. The intention of the review was to develop a roadmap to inform strategic development and integration of the transport data sources required to support Intelligent Mobility services like autonomous vehicles, real-time journey planners, and seamless freight delivery.

ITP's transport data expertise was used to lead this rapid review to understand how the transport revolution is impacting on the transport industry. We carried out desk-based research and facilitated strategic workshops with key decision-makers at the Catapult. The final project report was published in March 2015 as part of the Transport Systems Catapult's Insights series.

Oxford Smart City Strategy

The vision for Oxford Smart City is to create a place where innovative ideas, active citizens, and aligned stakeholders come together and collaborate openly to build a city upon new and emerging technologies. With a number of innovative demonstrator projects already underway in Oxford, the city and county Councils are aiming to become global leaders in Smart City delivery.

ITP was appointed to visualise and present the strategy for the Smart City project, providing technical input into why and how Oxford should want to achieve this vision. We were subsequently appointed to produce a summary 'manifesto' brochure, designed to bring the main strategy document to life through the use of informative and innovative graphics.

1 A Smart City In The Making